Load Cell
Overview
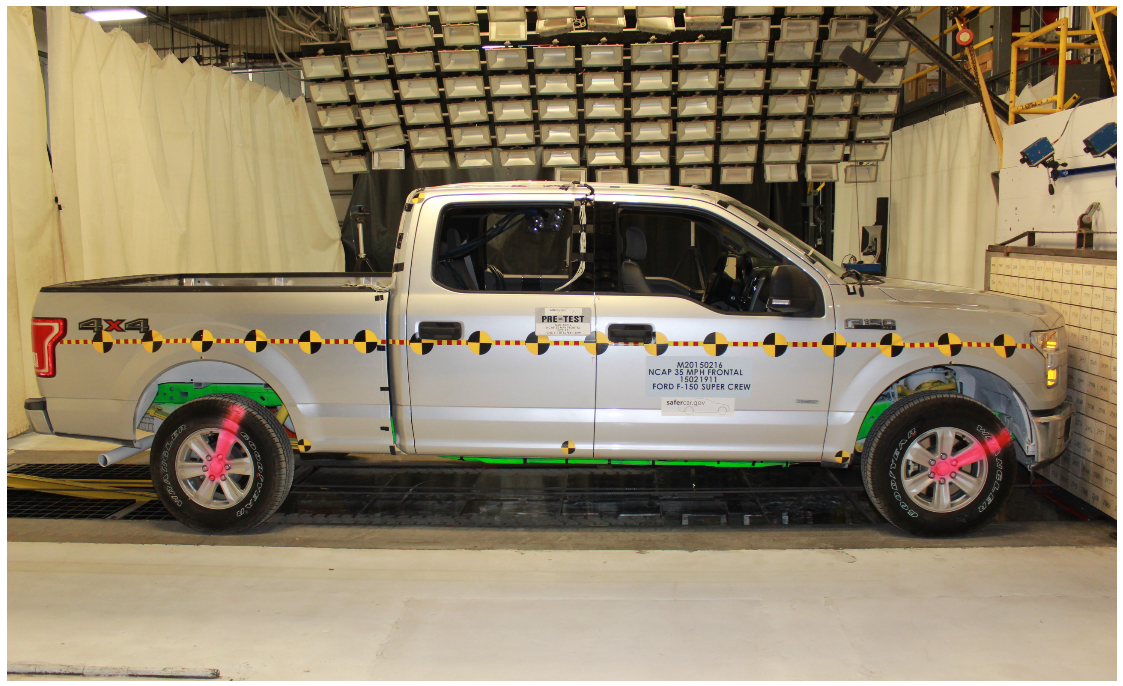
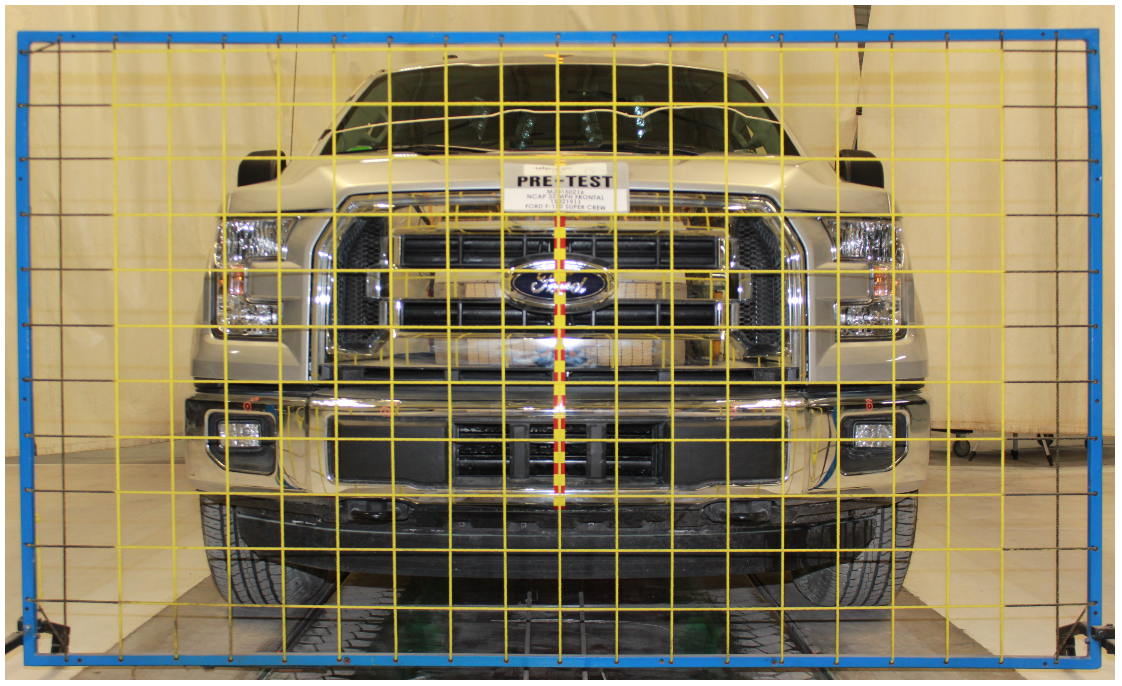
Load cell walls are utilized in New Car Assessment Program (NCAP) crash tests to assess a vehicle’s crashworthiness by measuring the forces exerted on a rigid barrier during impact (see Figures 1 and 2) [1]. These walls are equipped with sensors that capture detailed force data during a collision. The configuration of load cell walls can vary depending on the objectives of the test, the type of crash being simulated, and the organization conducting the assessment (see Figures 3 through 7).
 |  |
|---|---|
Load Cell Wall Configurations
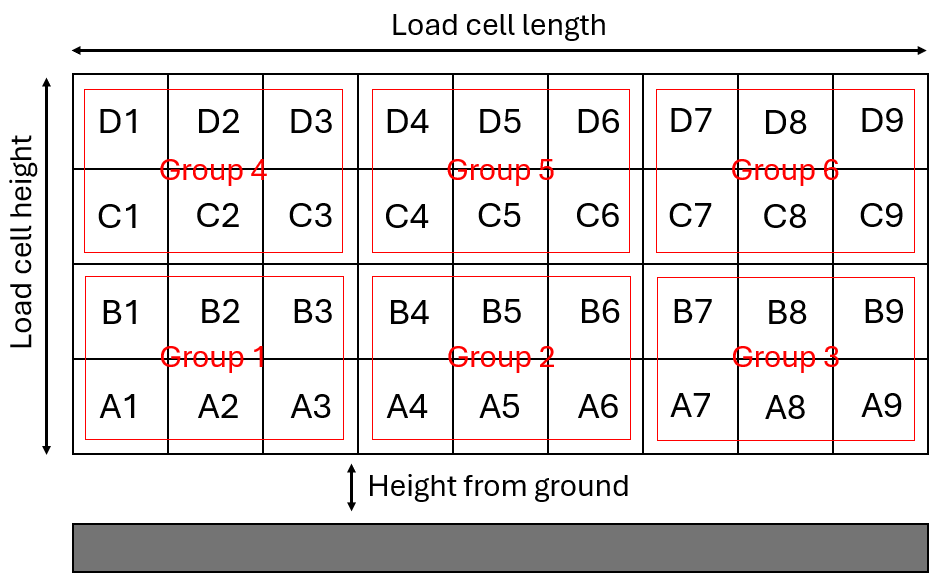
The low-resolution 4×9 load cell wall is commonly used by the Transportation Research Center for preliminary, frontal impact, or side impact crash testing [3][4]. These walls are comprised of 36 force measuring load cells, positioned in 4 rows with 6 groupings of 9 cells, used to measure axial forces [3] [4]. These walls are usually used in less detailed tests where the primary goal is to understand the general force distribution of a crash test over a large area rather than having a high level of measurement precision [3] [4].
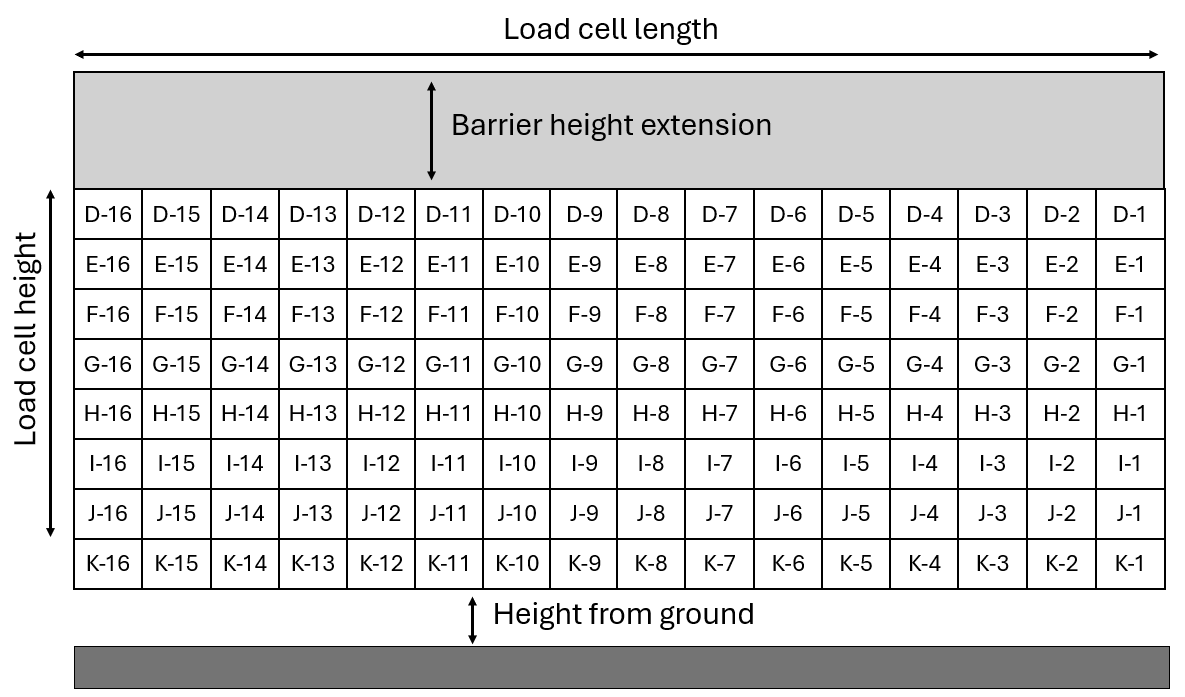
The high-resolution 8×16 load cell wall, equipped with an additional barrier height extension, is used by Calspan for advanced crash testing scenarios [5]. This configuration consists of 128 load cells arranged to provide detailed force measurements, with the height extension mounted at the top of the wall to increase the vertical measurement range. This feature is particularly beneficial for evaluating vehicles with taller front-end profiles that may impact the barrier at a greater height [3][5].
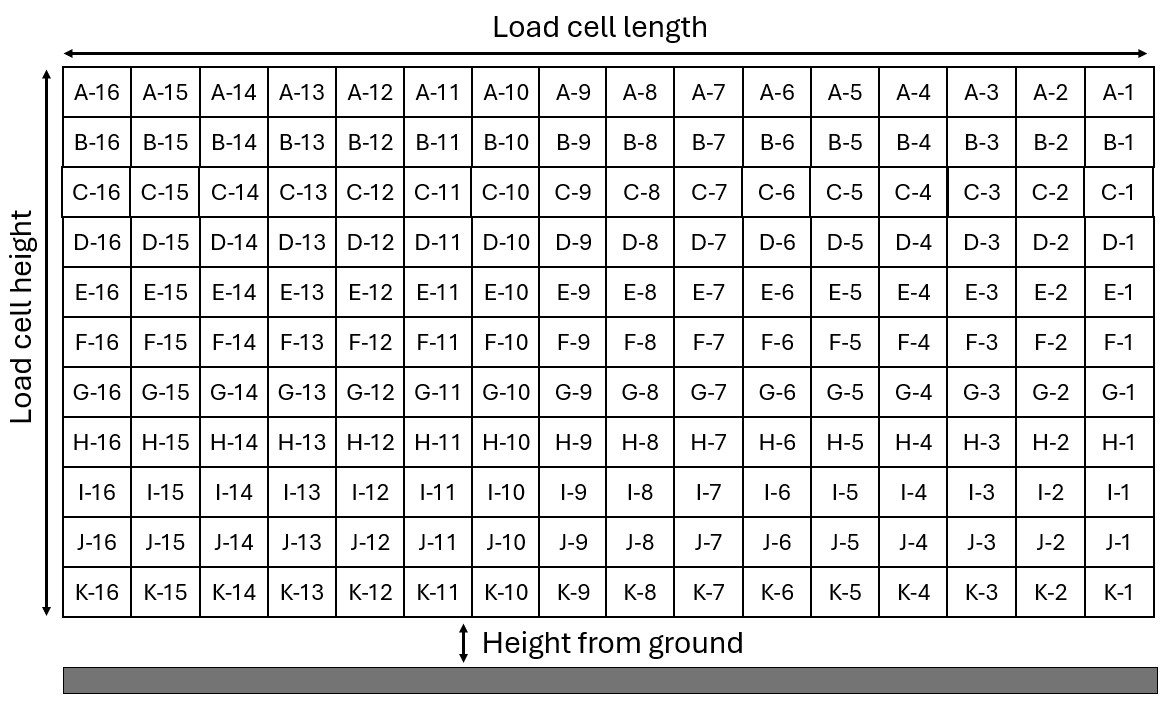
The high-resolution 11×16 load cell wall, used by Applus+ Idiada Karco Engineering LLC, is employed in various crash tests [3]. This configuration consists of 176 force-measuring load cells arranged in 11 rows of 16 cells, designed to measure axial forces during impact. The increased resolution of this setup allows for a more detailed mapping of impact forces, which can be beneficial for understanding how specific parts of the vehicle respond to the crash. This level of detail is particularly useful in complex scenarios, such as when the vehicle impacts the wall at an angle [3].
The high-resolution 11×16 load cell wall, used by the Transportation Research Center, is designed for a variety of crash tests [3]. This configuration consists of 176 force-measuring load cells arranged in 11 rows of 16 cells, enabling the measurement of axial forces during impact. The increased density of this setup provides a more detailed mapping of impact forces, which can be particularly useful for understanding how different parts of the vehicle respond to the crash. This level of detail is especially valuable in complex scenarios, such as when the vehicle impacts the wall at an angle [3]
The high-resolution 11×16 load cell wall, used by MGA Research Corporation, is employed in a variety of crash tests [6]. This configuration consists of 176 force-measuring load cells arranged in 11 rows of 16 cells, designed to measure axial forces during impact. The increased resolution of this setup allows for a more detailed mapping of impact forces, which is beneficial for understanding how specific parts of the vehicle respond to the crash. This level of detail is especially valuable in complex scenarios, such as when the vehicle impacts the wall at an angle [3][6].
Inputs
- Desired load test to evaluate
- The load test already includes the test performer used, load cell wall dimensions (height and length), and height above ground
Calculation
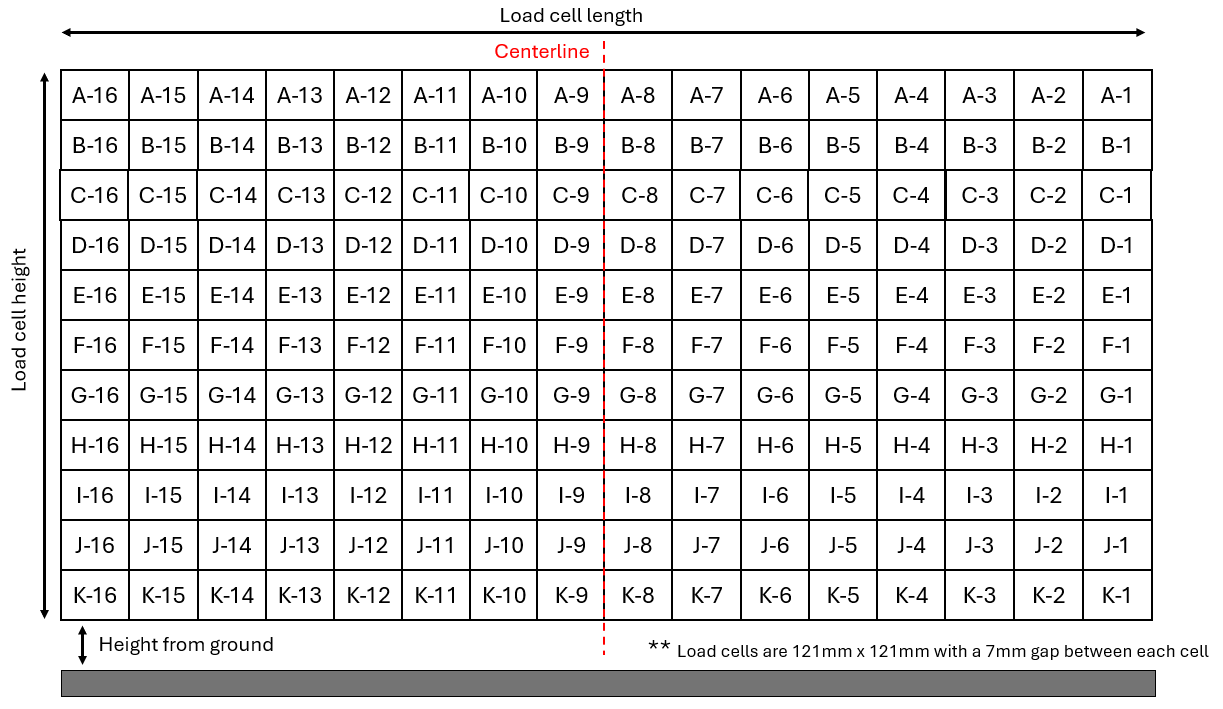
- Creates a matrix of filtered load cell force values and orients the matrix to match how the test performer views the barrier
- Converts the force values to Newtons and finds the peak force for each load cell
- Calculates the sum of all forces across all the load cells
- Creates graph of force (N) vs time of summed forces across all load cells
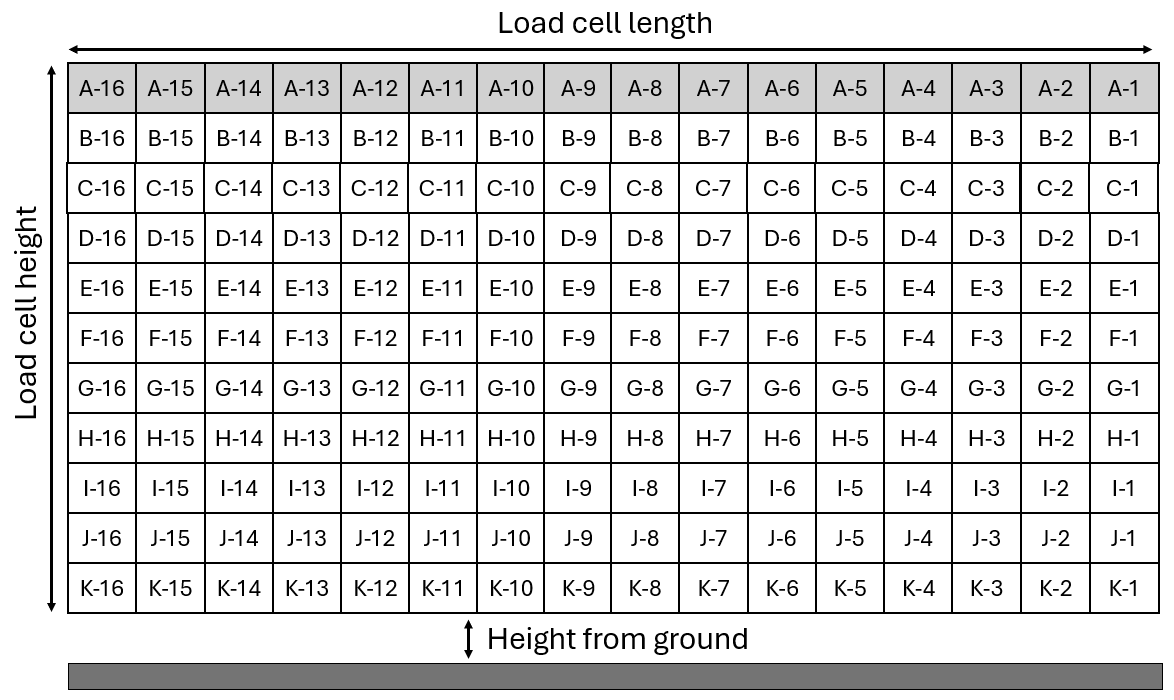
- Calculates the sum of all forces across each column
- Creates graph of force (N) vs time across each load cell row
- Calculates the sum of all forces across each row
- Creates graph of force (N) vs time across each load cell row
- Finds the peak force values at each load cell
- Creates heat map to display peak force values across the load cell wall
- Calculates the impulse for each load cell by integrating the force signal over the corresponding time (Equation 1)
- Finds the peak impulse value across all load cells
- Creates heatmap to display peak impulse values across the load cell wall
- Generates a series of graphs that illustrate different vehicle metrics. Each metric below is measured from the left and right side of the vehicle, but the type of impact test will determine the specific vehicle location where the metric is measured from. Below are the output vehicle metric graphs:
- Creates graph of vehicle acceleration (g) vs time measured from either side of the vehicle
- Creates graph of vehicle velocity (kph) vs time measured from either side of the vehicle
- Creates graph of vehicle displacement (mm) vs time measured from either side of the vehicle
- Creates graph of barrier force (N) vs displacement (mm) measured from either side of the vehicle
- Creates graph of vehicle energy (J) vs time measured from either side of the vehicle
- Kinetic Energy (Equation 2), Total Energy (Equation 3), and Work (Equation 4) are displayed on the vehicle energy graph
References
[1] K. Digges and A. Eigen."Measurements of Stiffness and Geometric Compatibility in Front to Side Crashes," The National Crash Analysis Center, George Washington University, Paper #349
[2] Takizawa, Higuchi, Iwabe, Kisai, Suzuki. "Study of Load Cell MDB Crash Tests for Evaluation of Frontal Impact Compatibility," Honda R&D Co., PSG CO., Paper #05-0235
[3] M. Jerinsky and W. Hollowell. "NHTSA's Review of High-Resolution Load Cell Walls' Role in Designing for Compatibility," National Highway Traffic Safety Administration, USA, Paper #393
[4] M. Herinksy and W. Hollowell. "NHTSA's Review of Vehicle Compatibility Performance Metric Through Computer Simulation." National Highway Traffic Safety Administration, Washington, D.C., IMECE2003-44045
[5] "2021 Nissan Versa 4-Door Sedan, Final Report," National Highway Traffic Safety Administration Office of Crashworthiness Standards, March 5th 2021, Report Number: NCA-KAR-21-007
[6] "2020 Subaru Outback 5-Door MPV, Final Report," National Highway Traffic Safety Administration Office Office of Crashworthiness Standards, December 26, 2019, Report Number: NCAP-KAR-20-2005