Intrusion Analysis
Description
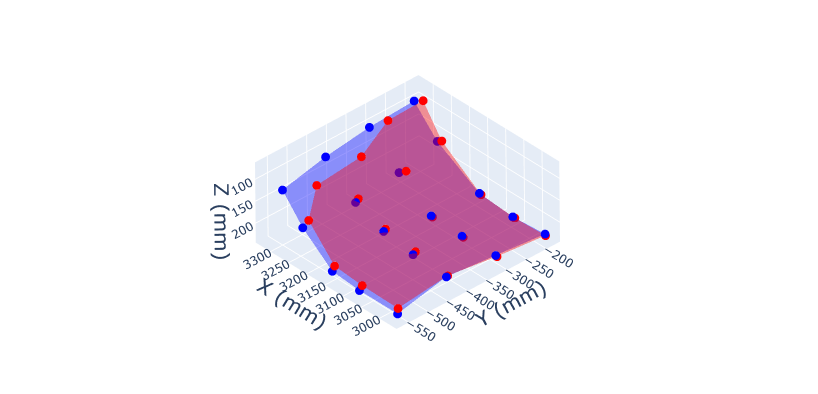
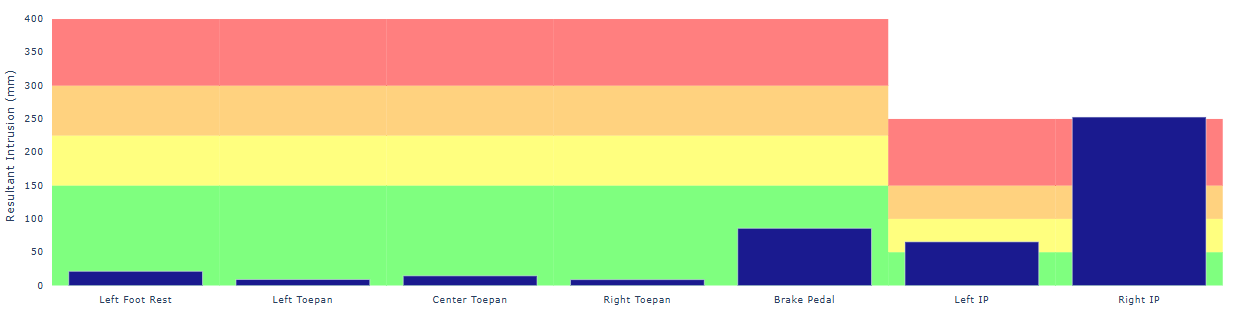
Intrusion Analysis compares pre-test and post-test coordinate measurements to show how far defined vehicle-interior points moved during a crash. It summarizes occupant-compartment deformation with a 3D point plot and regional bar chart [1] [2].
When this feature is available
Intrusion Analysis becomes available when at least one loaded vehicle test meets the requirements.
For a test to pass:
- The loaded test must be a vehicle test.
- The test must include at least one instrumentation record so WebSAT can associate the intrusion information with the loaded test.
- Intrusion information must be available for at least one vehicle.
- The intrusion information must contain one or more intrusion-point records.
WebSAT enables Intrusion Analysis from the test information. You do not need to select curves, but the loaded test must contain an instrumentation record.
Settings
This feature has no settings. Point labels, coordinates, and vehicle numbers come from the test information.
How WebSAT processes the data
- Load the available pre-test and post-test intrusion-point coordinates.
- Match corresponding X, Y, and Z coordinates for each measurement point.
- Calculate resultant motion for every complete point:
- Map recognized measurement names to the intrusion geometry.
- Compare each calculated motion with the configured severity thresholds.
- Group key measurements such as brake pedal center, driver left/right instrument panel, driver seat bolt, and steering column.
- Display the intrusion geometry, point measurements, and severity classifications.
How to interpret the results
Intrusion thresholds are location-specific visualization bands, not occupant AIS risk functions. Interpret the displacement magnitude and direction with the governing crash procedure and the vehicle coordinate/sign convention [1] [2].
Results
References
[1] Saunders, J. and Parent, D. “Repeatability of a Small Overlap and an Oblique Moving Deformable Barrier Test Procedure.” SAE Technical Paper 2013-01-0762, 2013. https://doi.org/10.4271/2013-01-0762.
[2] National Highway Traffic Safety Administration. NHTSA Test Reference Guide, Version 5—Volume 1: Vehicle Tests, November 2014.