Load Cell Analysis
Description
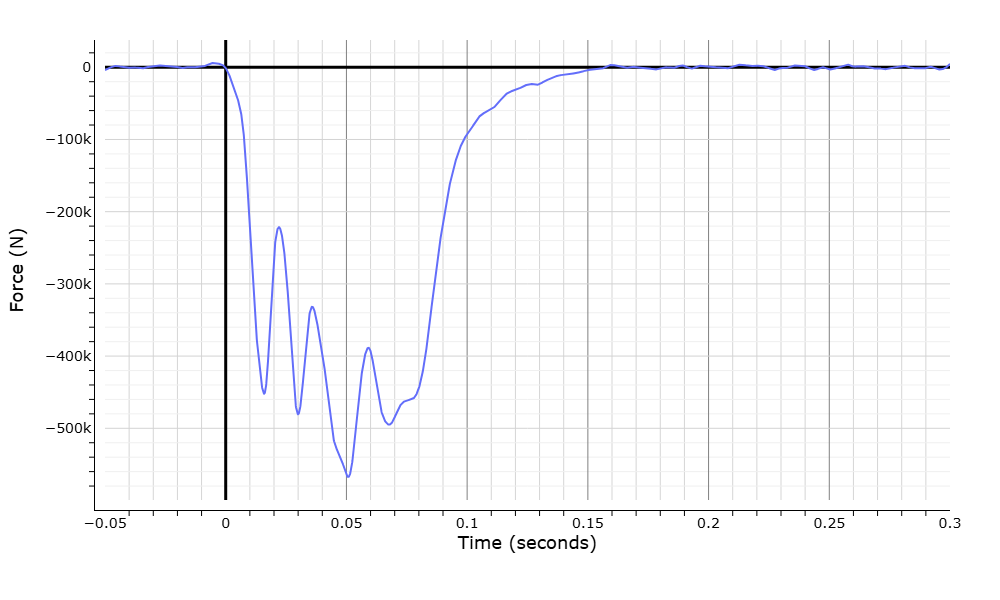
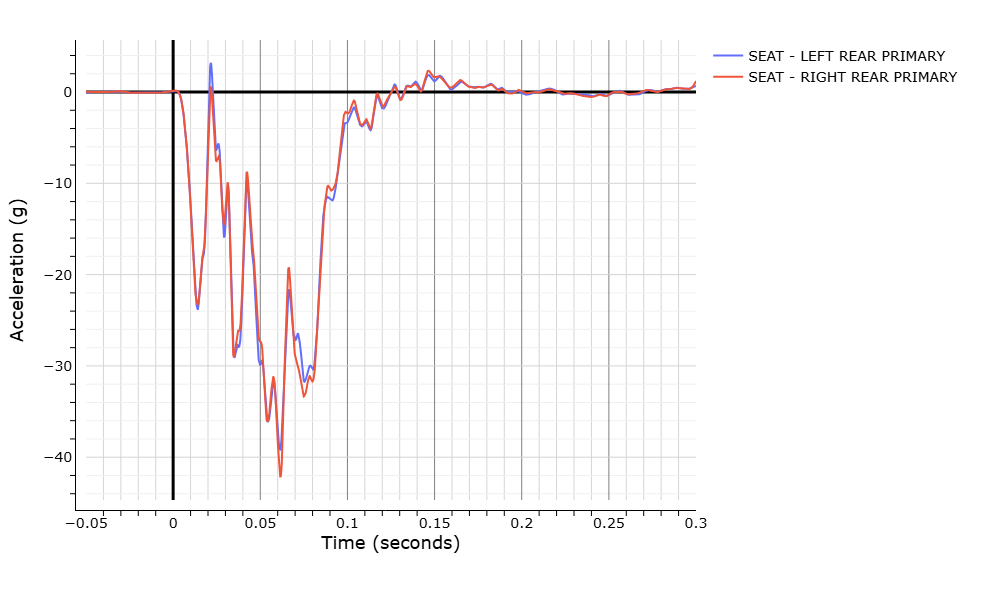
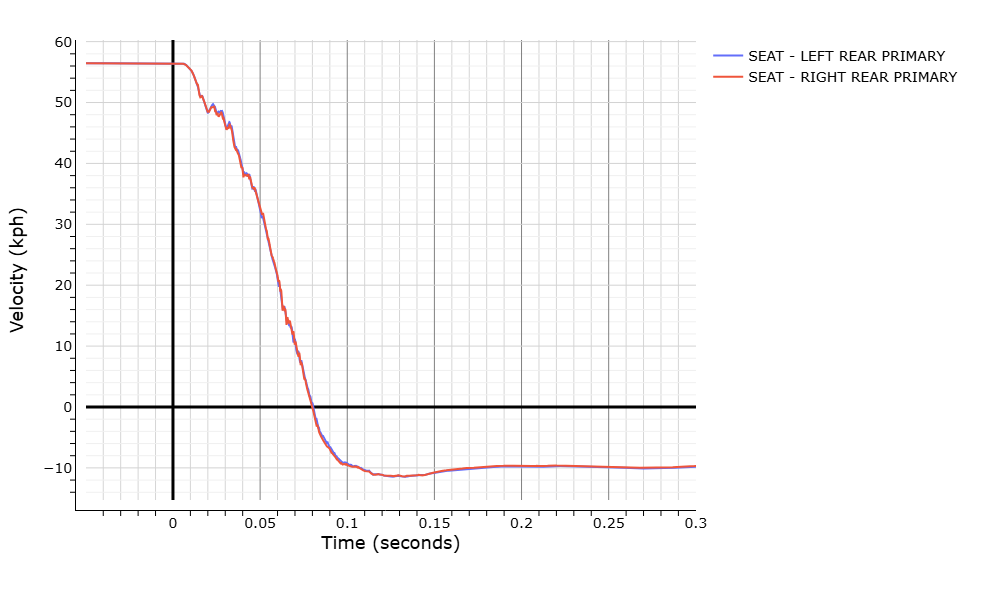
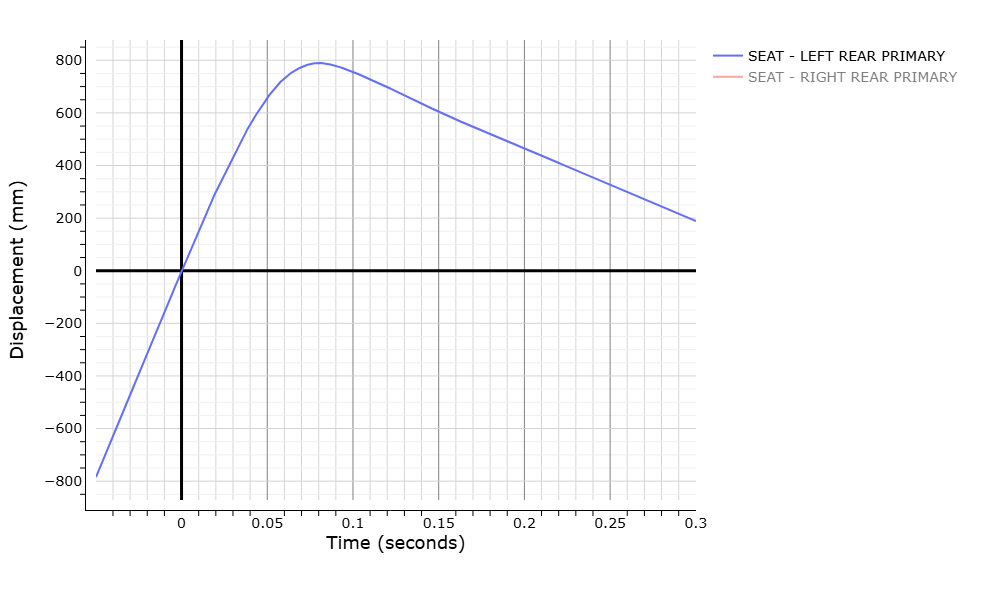
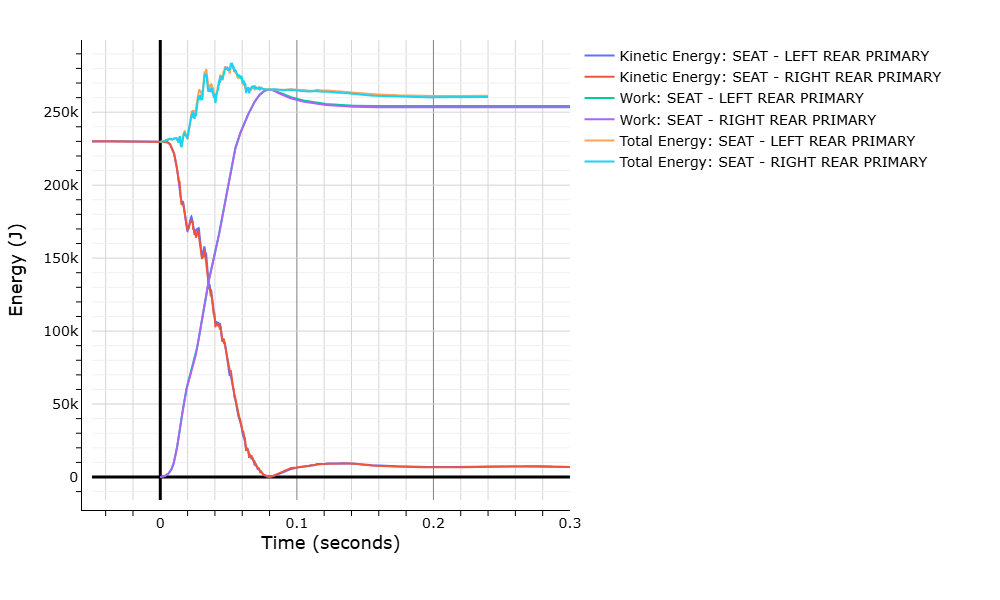
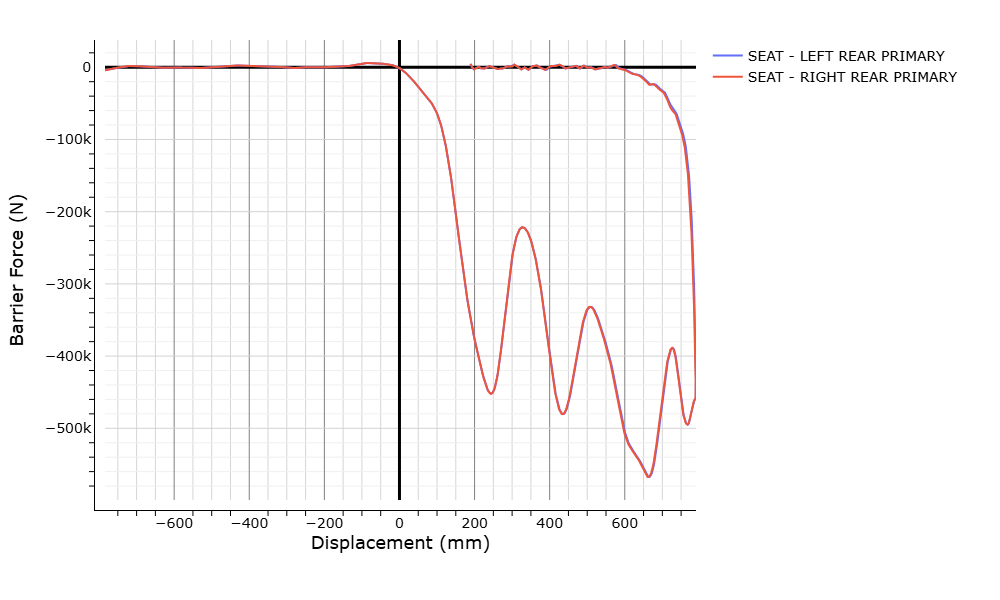
Load Cell Analysis evaluates force distribution and vehicle compatibility measures from a load-cell-wall crash test. It combines wall forces with a vehicle acceleration channel to describe impact force, impulse, height of force, stiffness, velocity, displacement, energy, and work [1] [2] [3] [4].
When this feature is available
Load Cell Analysis becomes available when either the current curve selection or at least one loaded vehicle test meets the requirements.
For a test to pass:
- The loaded test must be a vehicle test.
- The test must contain at least one load-cell force channel with units
NEWTONS. - The test must contain at least one acceleration channel with:
- Axis:
X - GLOBAL - Units:
G'S - An attachment containing
SEAT,FLOORPAN, orSILL
- Axis:
- Both channels must use the
NOT APPLICABLEsensor location and a usable data status.
WebSAT enables Load Cell Analysis when the required force and vehicle-acceleration inputs are present. Wall geometry and vehicle and test information are also needed for a complete analysis, while wall moment channels are not part of the requirements.
Settings
This feature has no settings. Wall layout, vehicle mass, impact velocity, and channel locations are read from the loaded test information.
How WebSAT processes the data
- Organize the barrier load-cell channels by wall row and column.
- Convert the inputs to consistent units and apply the required filtering.
- Sum the individual cell forces to obtain total wall force.
- Integrate force over time to calculate impulse.
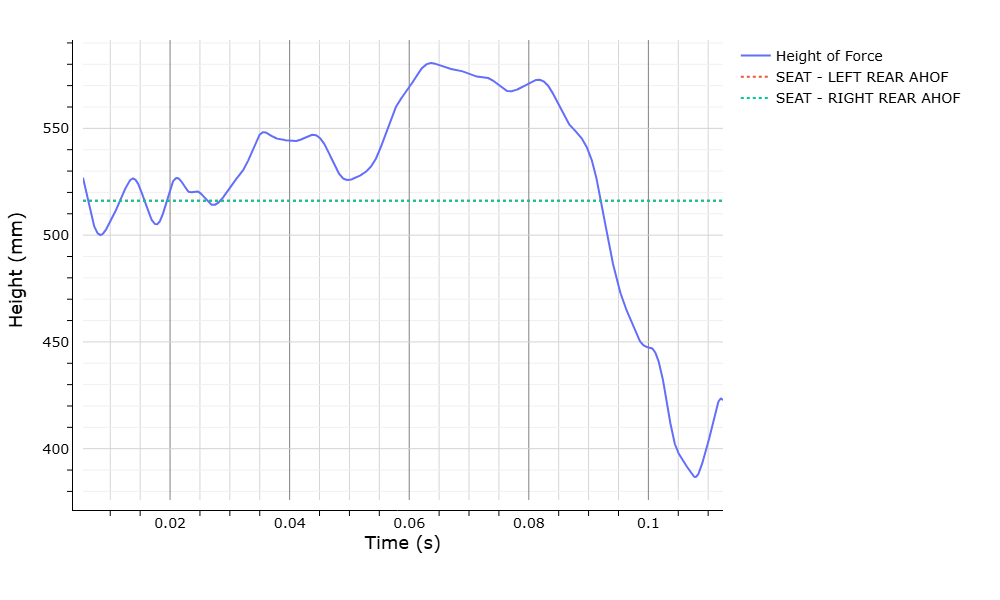
- Calculate the time-varying average height of force:
- Derive vehicle velocity and displacement from the selected vehicle acceleration.
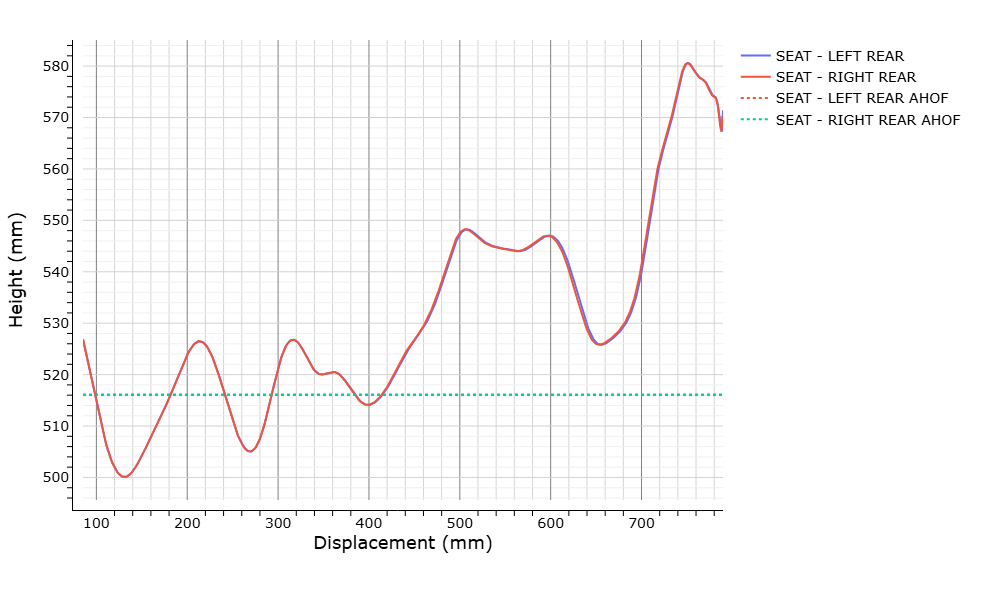
- Evaluate average height of force through 400 mm of vehicle displacement and calculate its variability.
- Calculate force-displacement work, initial stiffness, and:
- Prepare vehicle and occupant response comparisons when occupant channels are available.
- Report the wall-force, impulse, AHOF400, stiffness, work, and comparison results.
How to interpret the results
Load Cell Analysis does not apply an occupant IARV or AIS risk function. AHOF400, force distribution, and stiffness are compatibility descriptors; interpret them with the crash configuration and compatibility procedure used for the test [1] [2] [3] [4].
Results
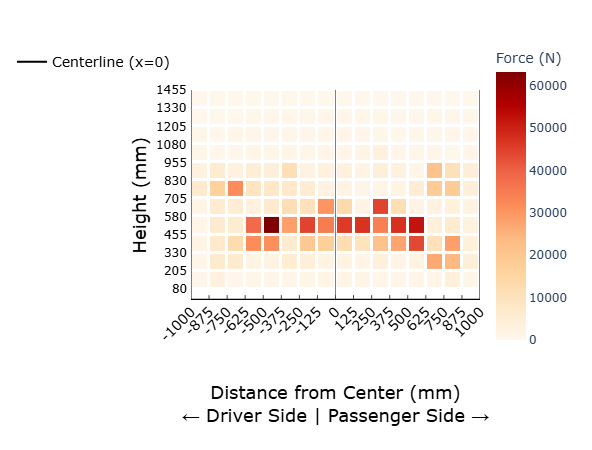
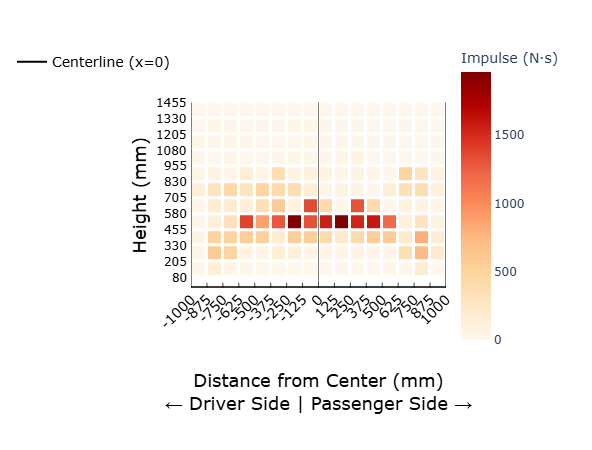
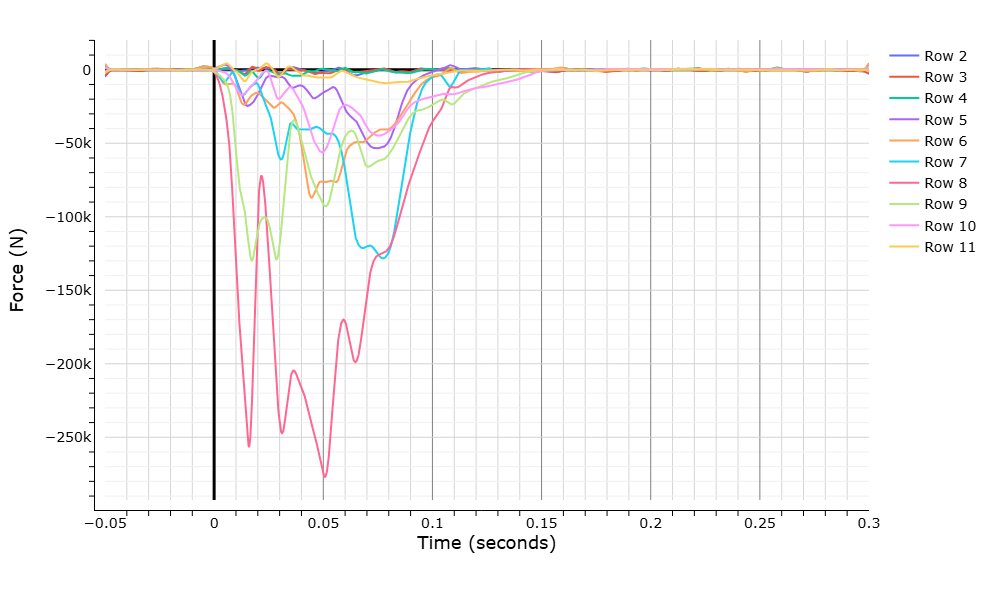
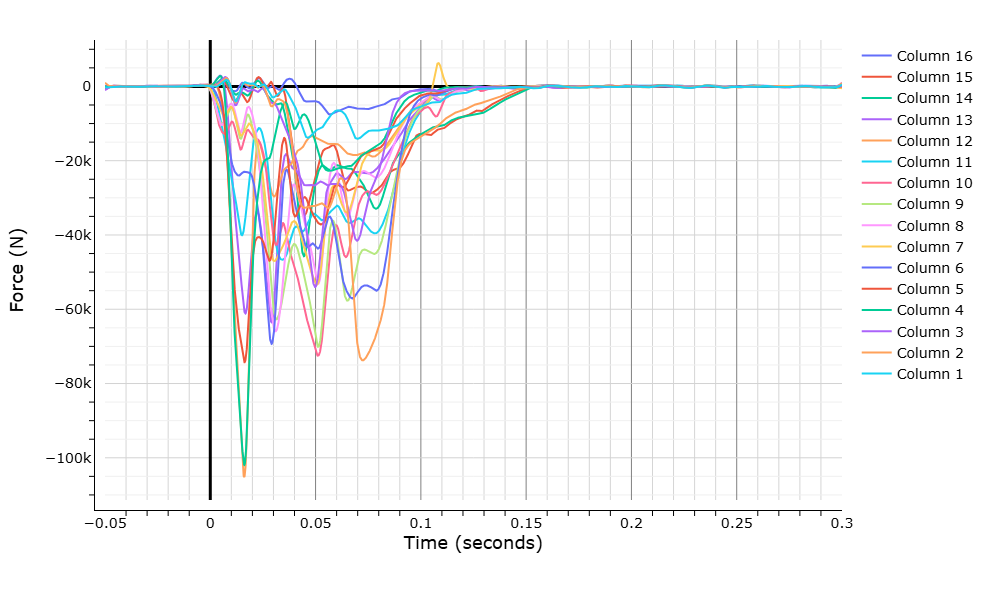
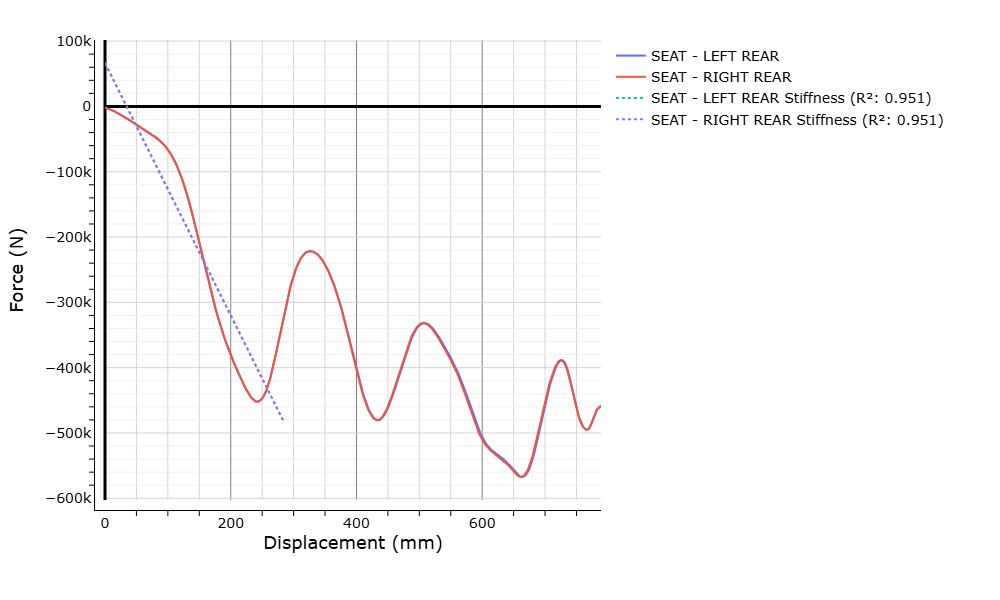
The summary reports the vehicle, test performer, barrier layout, wall dimensions, initial velocity, AHOF400 values and standard deviation, initial stiffness, and Kw400. The following examples show the populated graphs produced for a loaded load-cell-wall test. Vehicle-versus-occupant plots are also available when the test contains a qualifying occupant signal.

References
[1] Digges, K. and Eigen, A. “Measurements of Stiffness and Geometric Compatibility in Front-to-Side Crashes.” National Crash Analysis Center, George Washington University, Paper 349.
[2] Takizawa, H., Higuchi, K., Iwabe, T., Kisai, A., and Suzuki, K. “Study of Load Cell MDB Crash Tests for Evaluation of Frontal Impact Compatibility.” Paper 05-0235.
[3] Jerinsky, M. and Hollowell, W. “NHTSA's Review of High-Resolution Load Cell Walls' Role in Designing for Compatibility.” National Highway Traffic Safety Administration, Paper 393.
[4] Jerinsky, M. and Hollowell, W. “NHTSA's Review of Vehicle Compatibility Performance Metrics Through Computer Simulation.” IMECE2003-44045.