Compare Signals
Description
Compare Signals evaluates the agreement between selected curves and a reference. It reports magnitude, residual, similarity, statistical, and timing diagnostics and shows several corridor views.
When this feature is available
Compare Signals becomes available when the selected curves and settings meet the requirements.
For the selection to pass:
- At least two curves must be selected.
- The selected curves must have the same displayed signal units.
- Every numeric setting must contain a valid number.
- The curves may come from different loaded tests.
WebSAT enables Compare Signals when two or more unit-compatible curves are selected and all current numeric settings are valid.
Settings
| Setting | Default | Effect |
|---|---|---|
| Reference Signal | AVERAGE | Uses the average or one selected curve as the reference |
| Apply Filter | On | Applies the selected CFC before comparison |
| Filter CFC | 60 | 60, 180, 600, or 1000 |
| Corridor Size | 4.0 | Fixed half-width in signal units |
| Apply Truncate | On | Restricts comparison to the entered interval |
| Start Time / End Time | 0.0 / 0.3 s | Comparison interval when truncation is on |
How WebSAT processes the data
- Load the selected curves and convert them to a compatible sampling basis.
- Apply the requested filtering and truncation.
- Construct the calculated reference or use the selected reference curve.
- Align each comparison curve with the reference according to the current settings.
- Calculate the point-by-point residuals.
- Calculate absolute peak magnitude, residual mean and standard deviation, and percent outside the fixed corridor.
- Calculate cosine similarity, the t statistic, zero-through-fifth moment differences, and lag correlation.
- Exclude a selected reference from its own comparison row and from residual-spread estimates.
- Report the comparison table and supporting plots.
Results
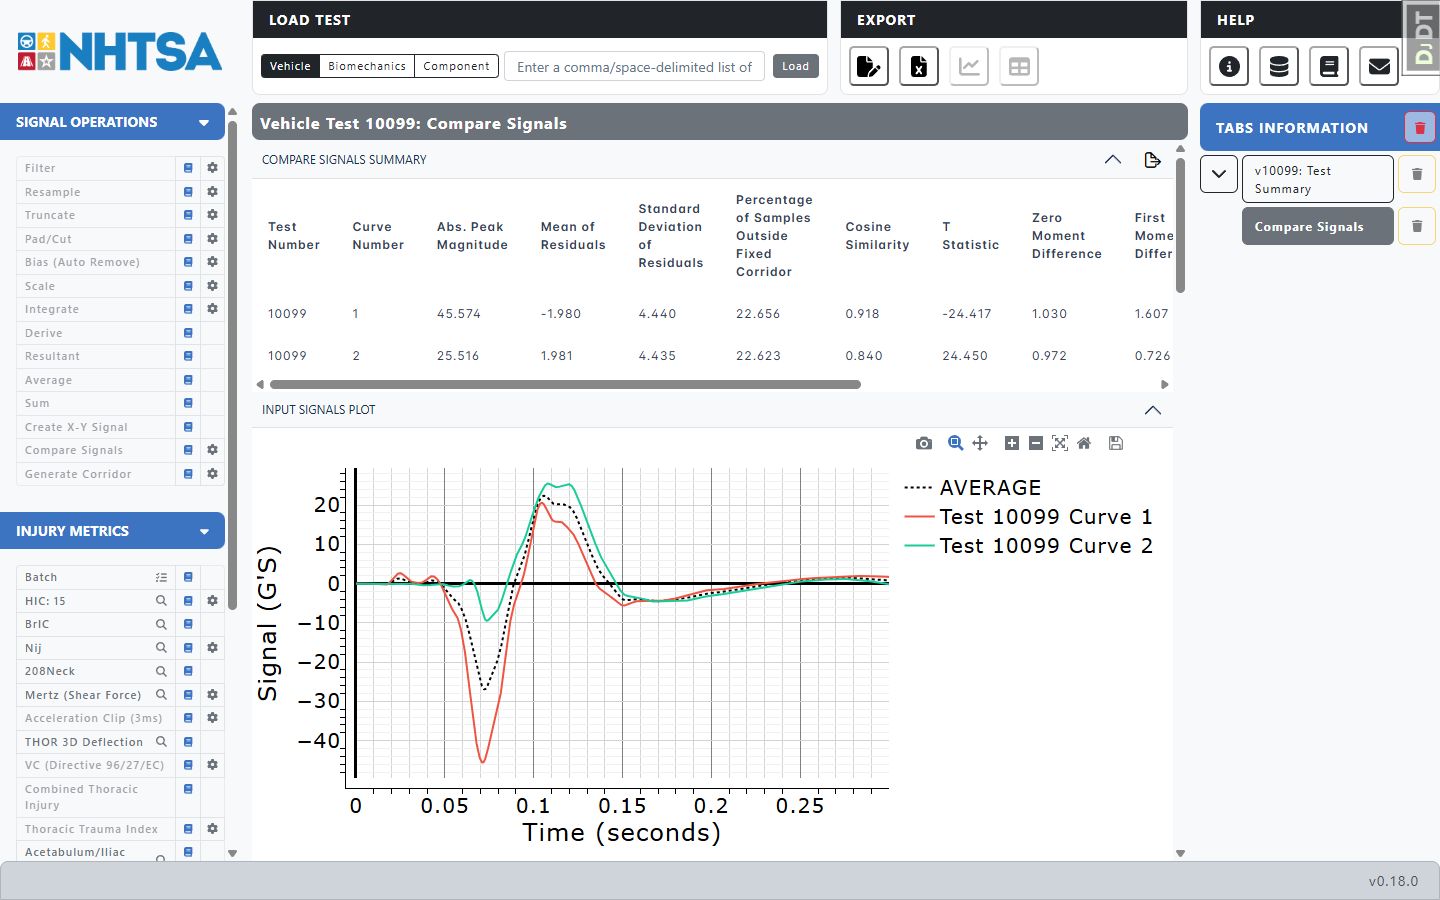
The results tab contains a summary table plus processed signals, the reference, residual and cumulative-residual plots, cross-correlation plots, and fixed, standard-deviation, and 90% residual-coverage corridors.
References
No injury reference value or injury risk function is applied. These outputs are signal-agreement diagnostics.