Generate Corridor
Description
Generate Corridor creates an average centerline and symmetric upper and lower bounds from a group of comparable curves.
When this feature is available
Generate Corridor becomes available when the selected curves and settings meet the requirements.
For the selection to pass:
- At least two curves must be selected.
- The selected curves must have the same displayed units.
- For a residual-coverage corridor, coverage must be at least 0% and less than 100%.
- For a standard-deviation corridor, the count must be from 1 through 3.
- If filtering is enabled, Filter CFC must be numeric.
- The curves may come from different loaded tests.
WebSAT enables Generate Corridor when two or more unit-compatible curves are selected and the settings for the chosen corridor method are valid.
Settings
| Setting | Default | Effect |
|---|---|---|
| Corridor Type | Standard Deviation of Residuals | Selects standard-deviation or residual-coverage bounds |
| Number of Standard Deviations | 1 | Integer from 1 through 3 |
| Residual Coverage % | Blank | Coverage from 0 through 99.9% |
| Apply Filter | On | Filters inputs before corridor generation |
| Filter CFC | 60 | 60, 180, 600, or 1000 |
How WebSAT processes the data
- Load the selected curves and place them on a compatible sampling basis.
- Apply the requested filtering.
- Align the curves on a common time axis.
- Calculate the average signal at every common time sample to form the corridor centerline.
- Calculate each curve's residual from the centerline.
- Pool the residuals to estimate a constant residual spread.
- Convert that spread to a corridor half-width:
- Standard-deviation mode multiplies the spread by the selected count.
- Residual-coverage mode applies the corresponding normal-distribution scale factor, approximately 1.6449 for 90% coverage.
- Add and subtract the half-width from the centerline to form the corridor boundaries.
- Display the centerline, boundaries, and selected curves.
Results
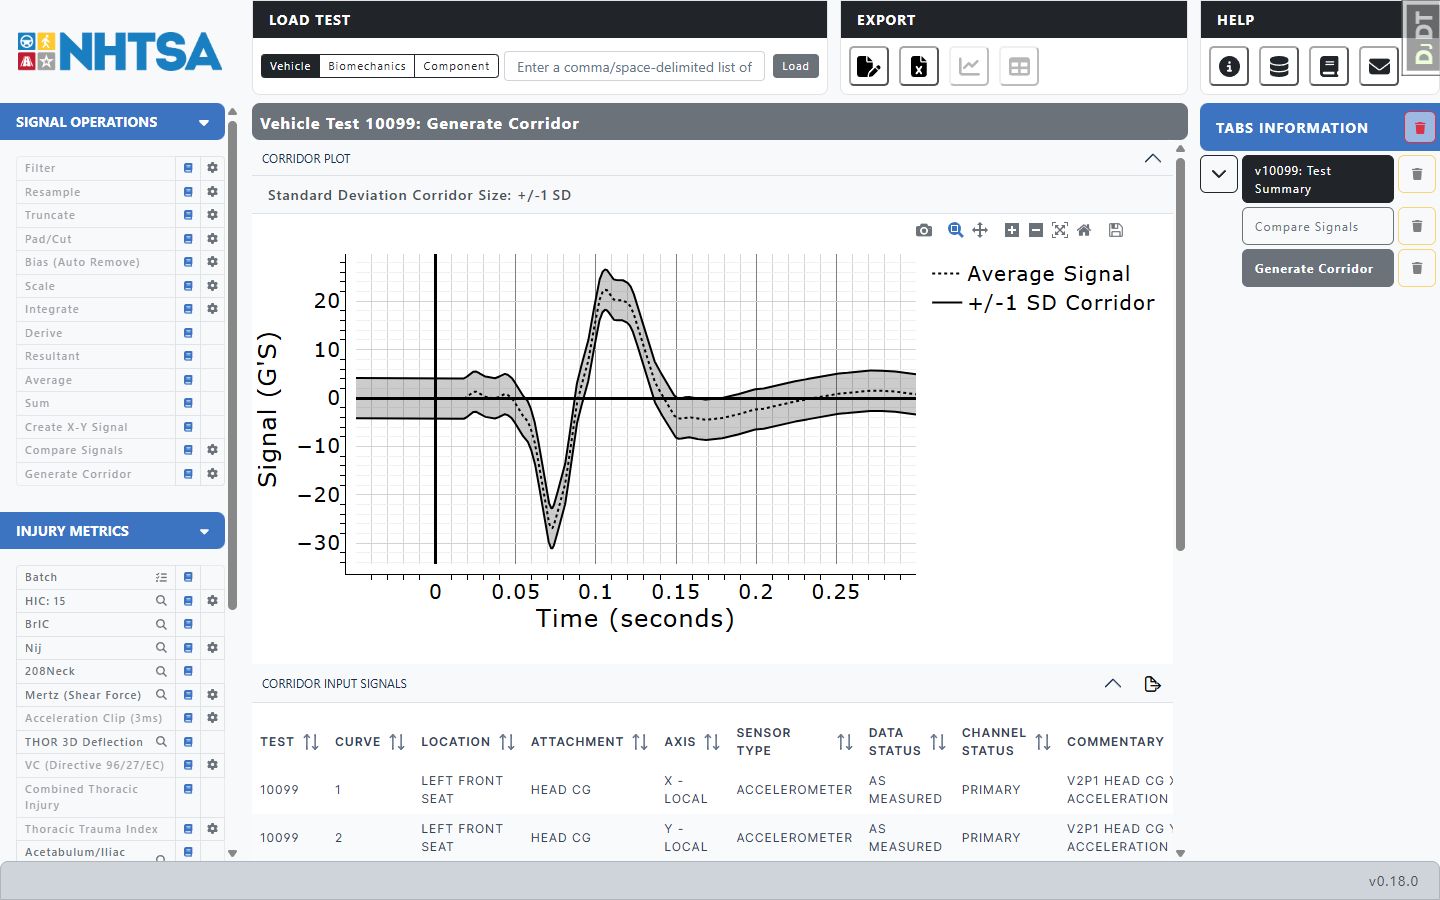
The result contains the Average Signal, Upper Corridor, and Lower Corridor curves. The results tab shows a corridor plot, the input-signal table, and instrumentation channels that can be plotted against the bounds. The legend identifies either +/-N SD Corridor or N% Residual Coverage.
References
No injury reference value or injury risk function is applied. A corridor describes the selected sample and is not itself a regulatory acceptance limit.